

I m currently the MUSE Instrument Scientist at Paranal. MUSE, the Multi-Unit Spectroscopic Explorer, is one of the most successful instruments at ESO. Its location in the fully adaptive telescope makes it also one of the most powerful in the world permitting ground-layer adaptive optics, GLAO, and laser tomography adaptive optics, LTAO, observations. The NFM allows observations with an image quality down to 55 mas with a Strehl of order 10% in the optical.
The operation of such complex instrument behind the tomographic Adaptive Optics Facility, AOF, present operation challenges that needs a fully multi-disciplinary team to keep it operational. Electric, electronics, mechanical, optical, and software engineers and technicians, together with an Adaptive Optics scientist support the astronomers in the group in the day-to-day operations.
Curren observatory responsibilities
Support astronomer at UT3 and UT4
Instrument Scientist for MUSE at UT4 at VLT
Former observatory responsibilities
Scientific contributions and interests
The stellar initial mass function of the Arches cluster.
After showing that the field of the LMC has an IMF with an upper mass slope consistent with the Salpeter
one, we approached the other emblematic cluster for which a deviant value has been claimed. We have shown
that the IMF slope in the upper mass range is also consitent with the Salpeter value. The details can
be found in Espinoza, Selman and Melnick (2009), soon to appear in A\&A. You can see an ESO press release.
Scale free star cluster mass function and a universal stellar IMF in clusters and the field..
After having determined that the stellar population in the field and in the ionizing cluster of 30 Doradus both have a Salpeter slope IMF we have discussed the implications in the context of] Kroupa and Weidner's arguments against the field IMF being the same as that of the IMF of stars in clusters. We presented our arguments in Protostars and Planets VI (Hawaii, 2005). We have refined the study since then, recognizing the significance of the statistics of the maximal star mass-cluster mass presented by Weidner and Kroupa by reproducing their results with our own simulations. The figure shows the contour map of this statistics showing the area permitted by the purely random sampling model but not covered by observations. We are using n-body simulations to determine the gravitational stability of the different parts of this diagram.

Intergalactic light in clusters of galaxies.
With Hernan Quintana from PUC and J. Melnick at ESO I have developed a technique to analyze imaging data in the optical in a manner analogous to that used in the infrared permitting accurate sky subtraction. The technical details are found in Melnick, Selman, and Quintana (1999). We are currently applying this technique to study the distribution of light in two clusters of galaxies. Preliminary results are presented in A&A 463, 833 (2007)
30 Doradus: star formation history and IMF.
With Jorge Melnick we have recently found that between 7 and 40 solar the stellar IMF in the field
of the 30 Doradus superassociation has a Salpeter slope. Dor details see this paper.
With Jorge Melnick, Roberto Terlevich and Guillermo Bosch we have written a series of papers on the properties of the ionizing cluster of 30 Doradus. Paper I deals with the data analysis and the distribution of reddening; Paper II , written by Bosch et al. deals with the spectroscopic study of the massive stellar population; Paper III , by Selman et al. deals with the IMF and star formation history; and Paper IV , by Bosch et al. started as an attempt to study the dynamics of the cluster and ended being a study of the binary fraction.
Stellar Formation and Evolution.
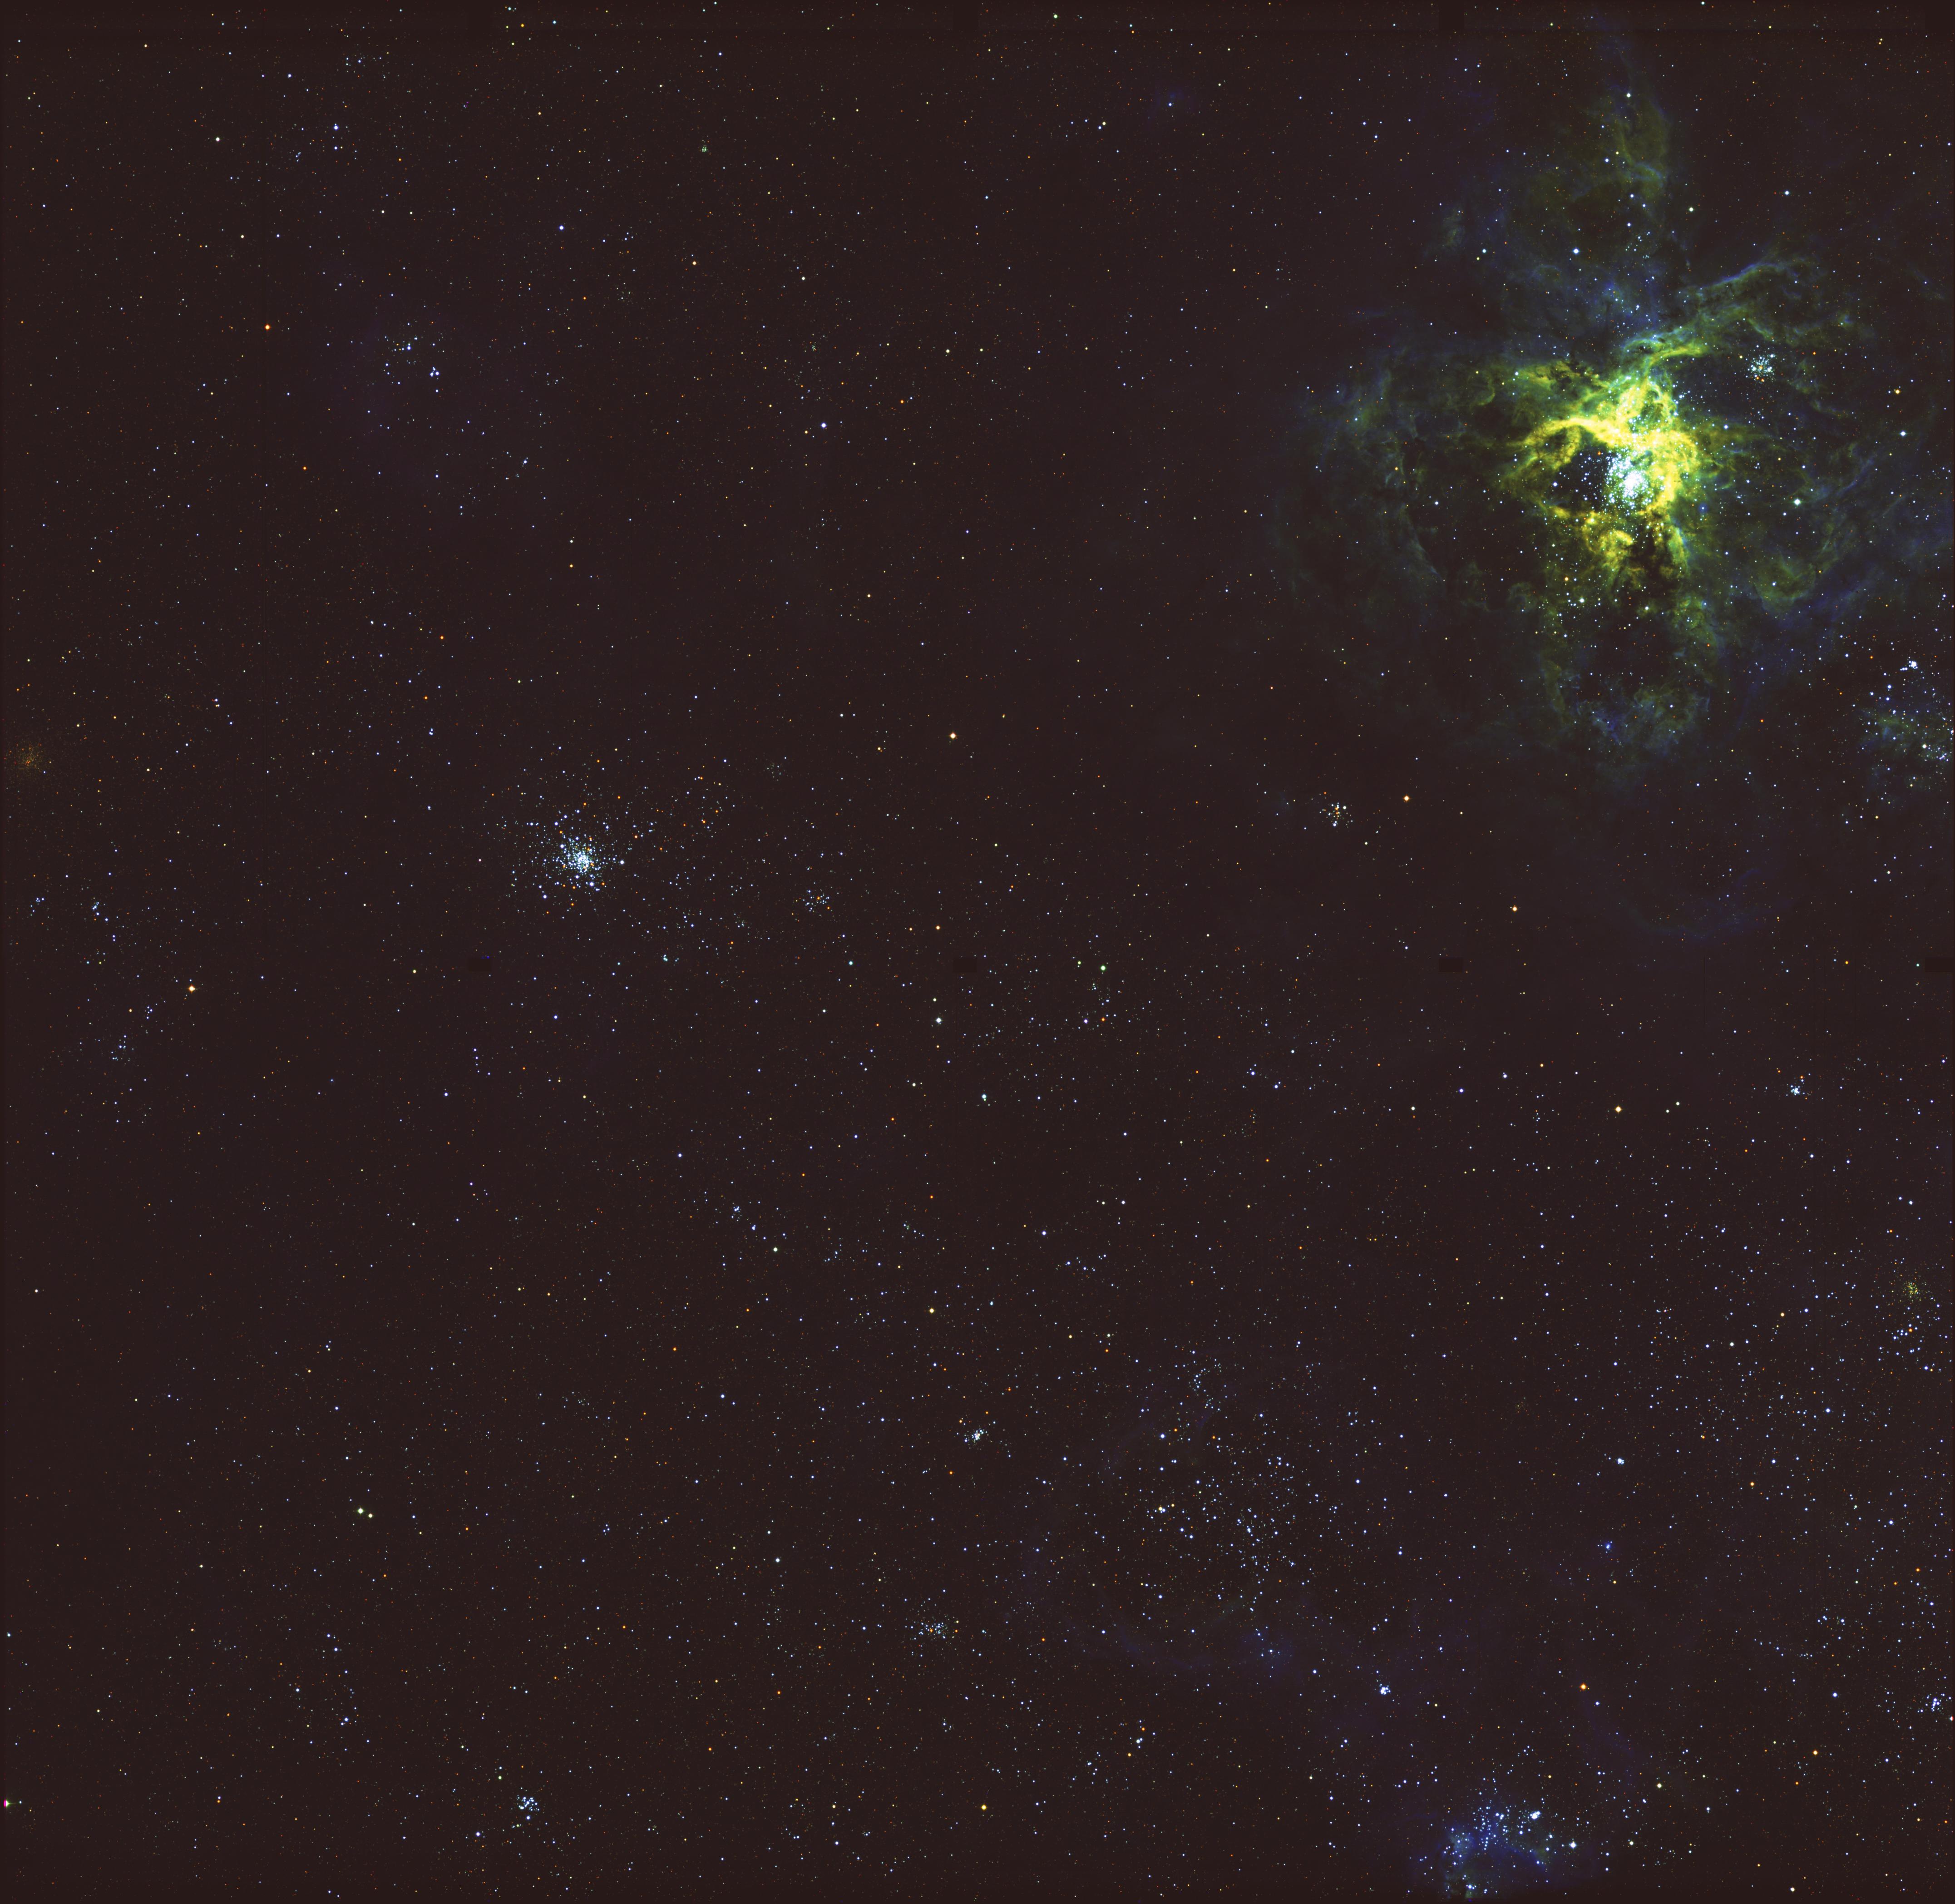
In order to study environmental effects on the IMF, and the star-formation history as a function of position I am in the process of extending the work from the ionizing cluster of the Tarantula to the larger super-association area. The data consist on 4 WFI pointings. To compare with the previous work I show how a single WFI pointing looks compared with an NTT SUSI frame used in the previous study.
You can look at the data from this frame, together with a few isochrones and the theoretical surface in this
Fractals and self-organized criticality.
If a system is sufficiently complex then there seem to be universal laws that take over and set some of the parameters of the system. The Universality of the IMF could arise from such complex chaotic processes.J. Melnick and I have published two papers on these issues; The first one deals with the fractal nature of the distribution of super-association sizes in galaxies and the second deals with self-organized criticality and star-formation.
Technological interests
Wide Field Photometry.
The photometry with wide-field cameras suffer the particularly troublesome problem of light concentration: the effective illumination on the focal plane is not uniform and tends to be concentrated toward the center. This gives the mistaken impression that the relative sensitivity near the center of the field is larger than it really is. Because the problem affects both flat-field and science frames we do not notice it unless we do aperture photometry of the same stars across the field. I have developed a method to determine the correction as a function of position which allow me to correct to better than 1%. These results are presented with some detail in a paper at the 2004 SPIE meeting in Glasgow.
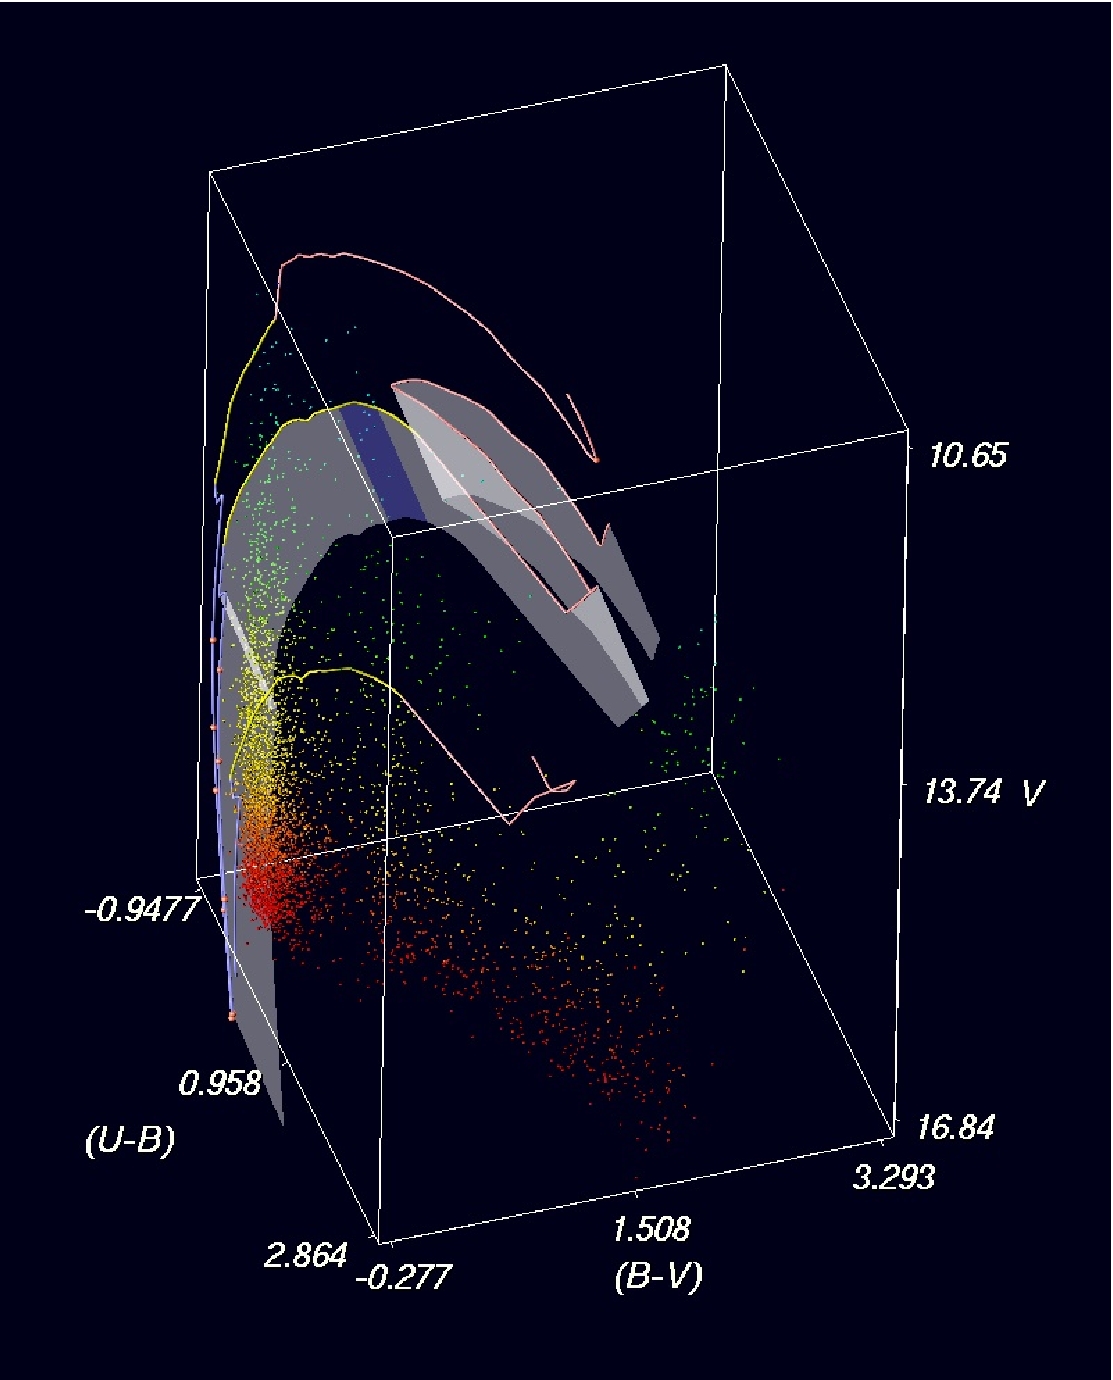
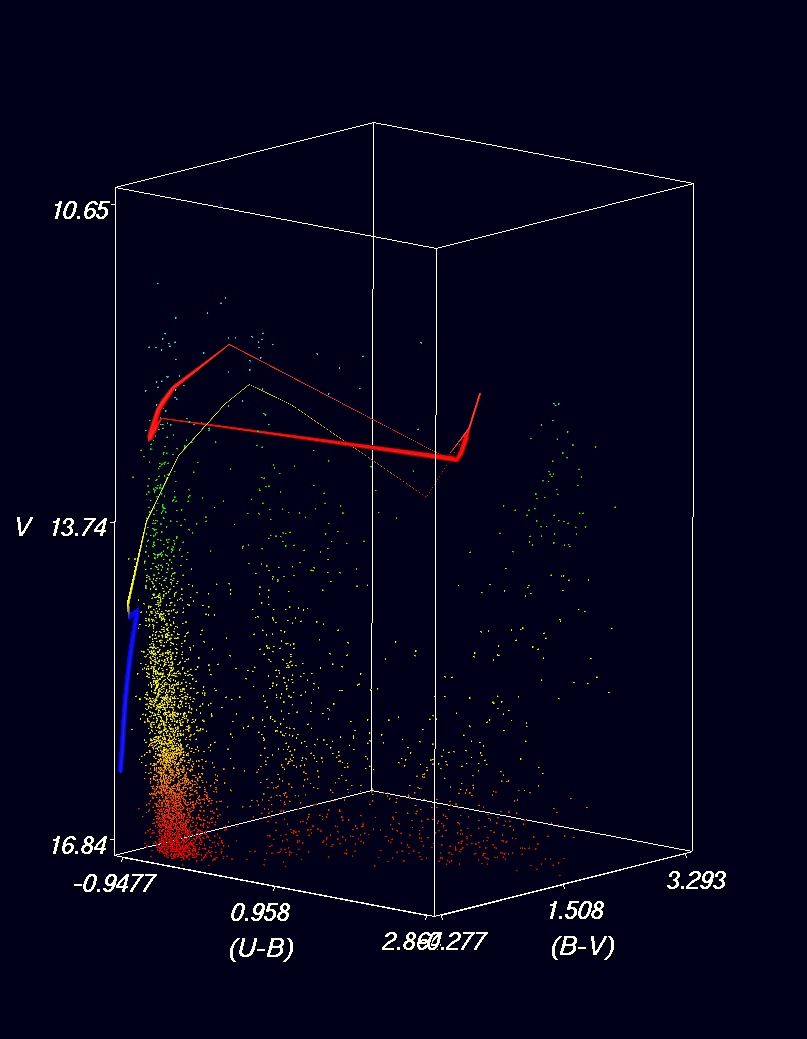
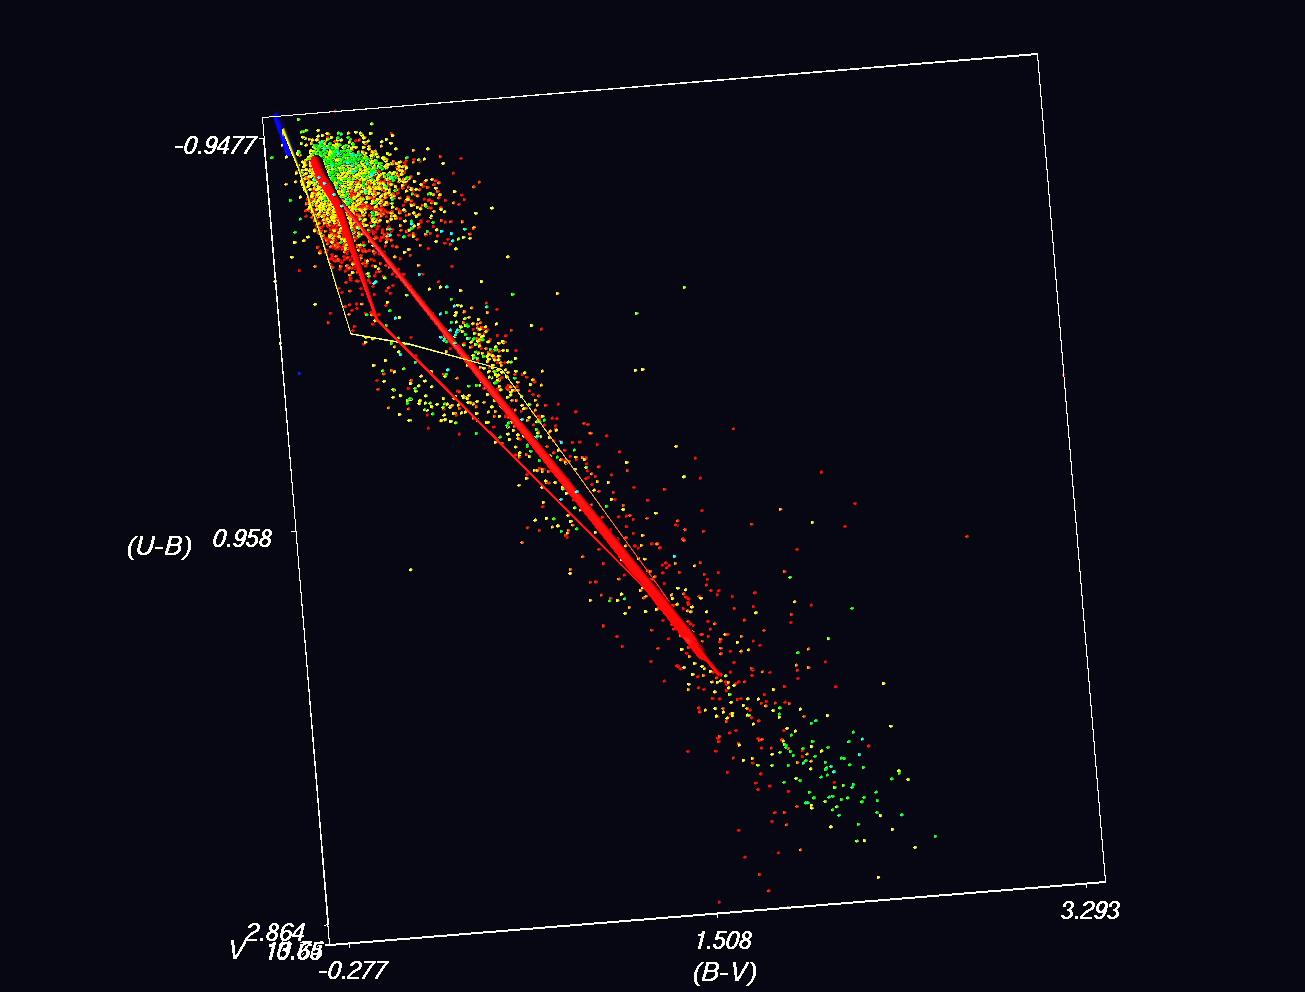
Visualization of scientific data.
When the amount of data to be analyzed is large it becomes imperative to have powerful means of visualization. I am developing tools based on VTK, and written in C++, Tcl, and Python to visualize the large amounts of data that come out of WFI. You can see an example in the previous section. Here I present a slightly more elaborated one in which I super-impose on the data the evolutionary track of a 12Msun star. The color of the tube represents the luminosity class: I, red; III, yellow; and V, blue; the width of the track represents the speed at which the star is traveling in the stereogram, as it evolves. I have painted the star of different colors according to their V magnitude so that they can retain this information when seen from another perspective. Statistical techniques. It is not enough to visualize the data, but we must be able to extract the information in an optimal way. I have developed a Bayesian technique that allow us to go from classical UBV photometry to masses, ages, and extinctions. This technique is presented in Paper III.
Last updated 2008-May-15