MCMC Coffee 
More Coffee More Confidence
Coffee sessions will take place at the Vitacura Office Library at 11:00am on alternate Thursdays. Below you can see the scheadule for the following weeks.
| Date | Title | Speaker | Abstract | Figure |
|---|---|---|---|---|
| April 28, 2016 | Presenting the MCMC Coffee | J. Lillo-Box & A. Plunkett | In this talk we will present the goals and format of the MCMC Coffee together with some ideas of what we are looking forward to see in these sessions. |  |
| May 12, 2016 | Parametric bootstrapping to get uncertainties | Elyar Sedaghati | This is a follow-up on the Python Coffee from May 5, now exploring parametric methods for fitting data. It is paramount to quote realistic and conservative estimates of precision on the derived parameters of the model being investigated. I will, very briefly, discuss a few different ways of obtaining these parameter uncertainties, and continue the discussion of the bootstrapping technique application for robust determination of those errors. While I’ll be using Python, the statistical methods and the difference between parametric and non-parametric methods are important for data interpretation, regardless of what language you prefer. | |
| May 26, 2016 | How to fit a (straight) line | Antoine Mérand | Please comme all to what sounds like the most terrible subject, so boring and so basic nobody will want to come! I fit straight lines for a living: I am interested in estimating zero-points of the (linear) Period-Luminosity relations for Cepheid pulsating stars. Still, I did not even understand what I will present until recently. I *promise* most of the attendants (if not all) will learn something! If you think you know everything about (straight) line fitting, come at 11:00 for the MCMC coffee and lets discuss this topic together. | 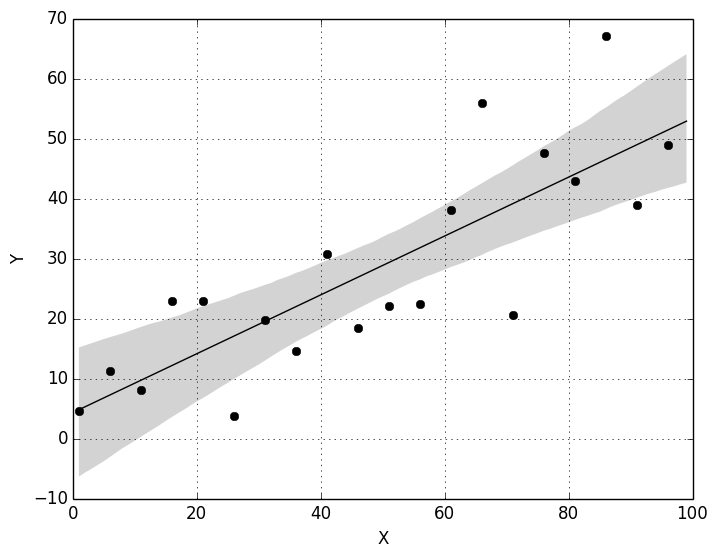 |
| June 09, 2016 | Principle Component Analysis (PCA): on the the importance of “having heard about something” | Antoine Mérand | This presentation is both about the numerical method and a personal experience I had with it. You will not master the PCA after this coffee, but you will have heard about it, which is invaluable. PCA is a mathematical framework to perform dimensionality reduction. It is widely used for data compression or data classification for example. Even if you are not a numerical nerd like me, come anyway to hear about probably the biggest missed opportunity of my career. | |
| September 1, 2016 | Descriptive statistics and distribution funtions | Jorge Lillo-Box | In this first session of the first proper season of the MCMC Coffee I will give a very brief introduction to the basics of the tools that we have to describe our data (mean, median, standard deviation, skewness, kurtosis, etc.). I will review different shapes in which our data can be distributed as well as their properties and when can they be applied. | 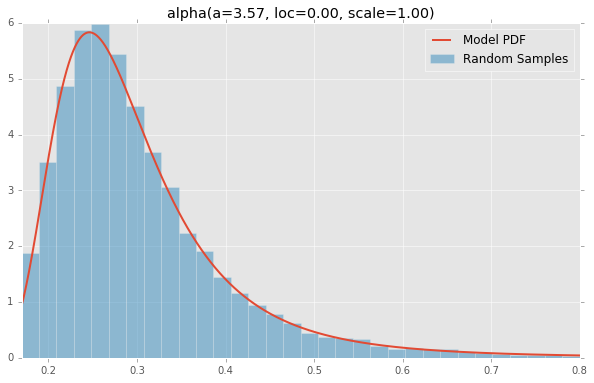 |
| September 15, 2016 | Central limit theorem and correlation coefficients | Daniel Asmus | In this session, we will continue our adventure deeper into the realms of statistics and explore why/when repeating measurements can be a good idea, i.e. leading to more accurate results, and how we can test whether two measured quantities correlate quantitatively. On our journey, we will encounter the central limit theorem, Kendall's Tau, Pearson's and Spearman's ranks, and possibly some other treasures. But beware of the pirates! |  |
| October 05, 2016 | Maximum Likelihood Estimations I: synthetic colour-magnitude diagram fitting | Bruno Dias | Maximum Likelihood Estimation (MLE) is a common special case of the frequentist philosophy. At the same time Bayesian philosophy is tied to likelihood. Therefore, likelihood-based approach deserves special attention in the MCMC coffee. In this session we will see the application of MLE to the case of synthetic colour-magnitude diagram fitting. This is becoming a very common technique to derive age, metallicity, distance, and reddening of star clusters. In the past, people assumed metallicity, distance, and reddening from other sources and fitted by eye an isochrone line to constraint the age of a star cluster. During the case study some theoretical concepts will be briefly revised. | 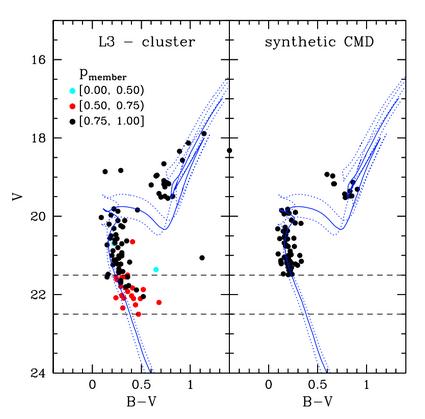 |
| October 06, 2016 | Maximum Likelihood Estimations II: hypotheses, distributions, modeling and histograms | Adele Plunkett | We will continue our discussion of Maximum Likelihood Estimation (MLE). In this session, I’ll explain hypothesis testing and comparison of distributions. For example, when analyzing your observations how confident are you that the source you detected is indeed a source, and not background noise? In statistics-speak, can you reject the “null hypothesis”? In another case, how do you know when two measurements/observations indeed imply a difference in the measured quantity? I will explain parametric versus nonparametric tests of sample distributions. Finally, we’ll explore how histograms represent a general feature of nonparametric models, and we will learn how to get a histogram “right” by choosing the number and size of bins. Most generally, astronomers should understand how to effectively measure and present their statistical analyses with confidence. | 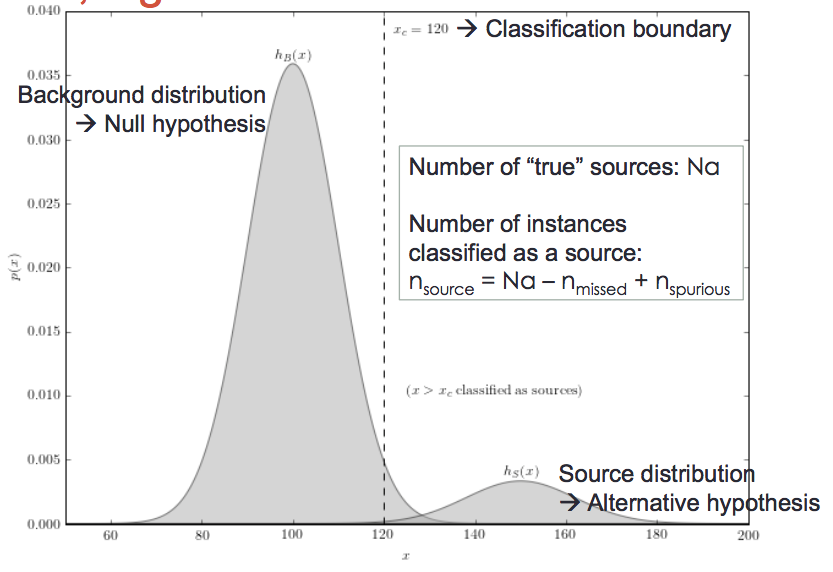 |
| October 27, 2016 | Bayesian Inference 1 (Bayes theorem, priors) | J. Lillo-Box & A. Plunkett | After learning the principles of Maximum Likelihood Estimation, in the next two MCMC sessions we will learn the very basics of Bayesian Analysis. In this first part, we will dissect the Bayes Theorem and show some examples to illustrate the power of this statistical analysis. | 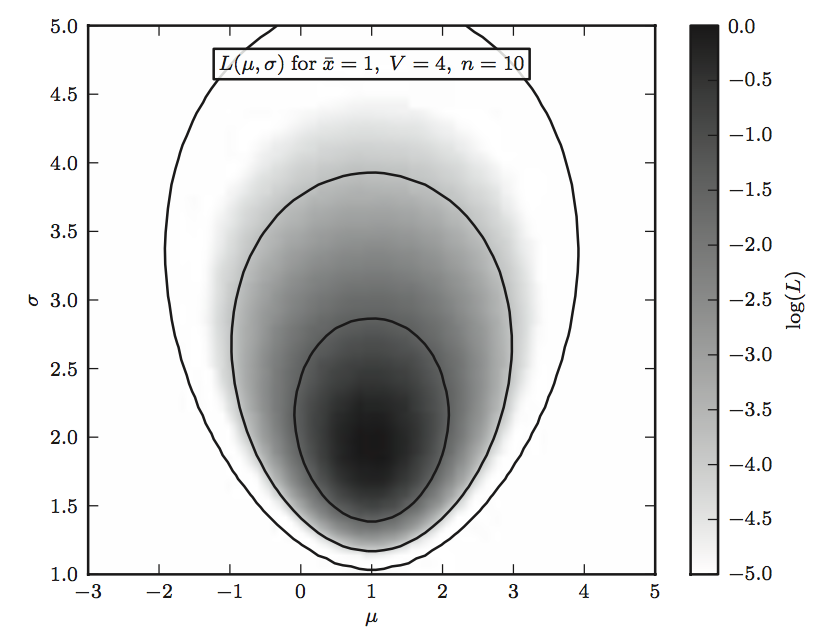 |
| November 10, 2016 | Bayesian Inference 2 (model selection) | Blake Pantoja | 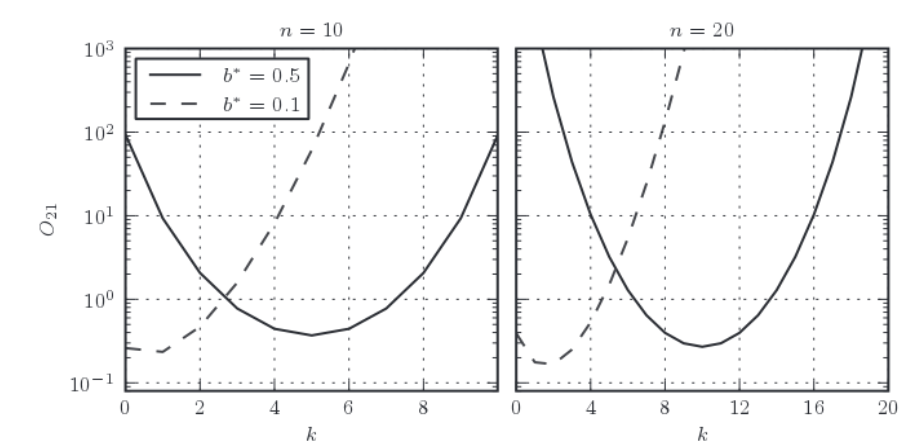 |
|
| February 2, 2017 | Identification of planetary signals with posterior samplings | Mikko Tuomi | Various sampling techniques are applied when analysing radial velocity time-series in a search for planetary signals. We focus on adaptive Metropolis sampling algorithm with delayed rejection to identify maxima of a multimodal posterior probability distribution potentially corresponding to such planetary signals. The greatest advantage is that any noise models accounting for stellar activity and instrument noise can be used with equal(*) ease and their free parameters can be estimated simultaneously with the orbital parameters to avoid analyses of data residuals that are known to lead to biased results. Although this comes with a computational cost that increases linearly as a function of the number of data and heavily as a function of number of free parameters, Moore's law keeps enabling faster and faster computational facilities. | 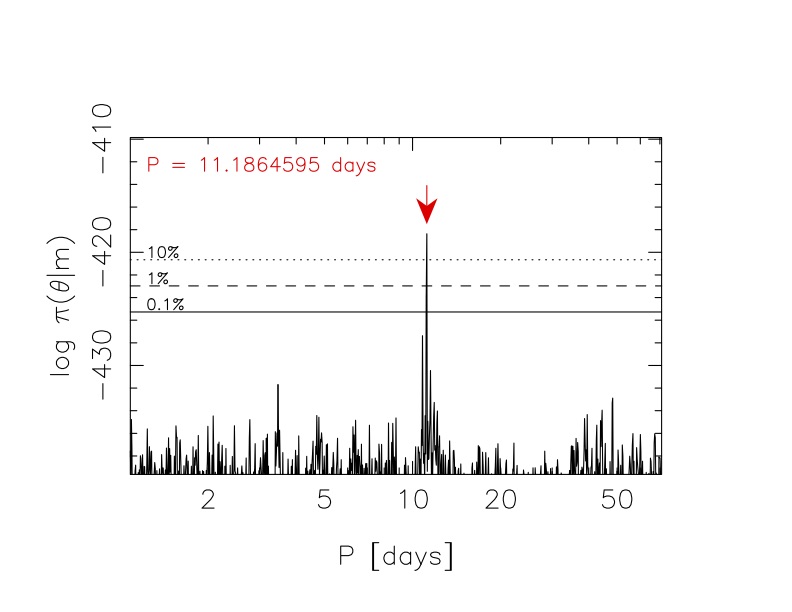 |
| February 16, 2017 | The many flavours of Machine Learning | Hugo Mesias | With the increase in data-base size and complexity the community is exploring more and more machine learning algorithms not only to describe data-sets, but also to use its predictive capability. Here, different varieties of machine learning algorithms will be presented, explaining differences and giving examples of supervised, unsupervised, semi-supervised, and reinforcement algorithms. Some python examples will also be given making use of the scikit-learn package. | |
| March 16, 2017 | MCMC orbital fitting of RV and astrometric data | Blake Pantoja | ||
| March 30, 2017 | Trans-dimensional Bayesian inference (or how to compare models without doing model comparison) | João Faria | Very often we are faced with a problem like this: a certain number of individual components are combined to create a signal which we observe (together with some noise) in a given dataset. We would like to use the data to infer not only the properties of each individual component, but also the number of components that make up the signal. Examples are the detection of galaxies in a noisy astronomical image,or inferring the number of planets in an exoplanet system from radial velocity (RV) data. I will focus on this second example, while presenting a recent algorithm to perform MCMC and estimate posterior distributions on these problems with varying number of parameters. This method allows us to estimate all the planets' orbital parameters at the same time as we estimate how many planets are in the system. All within the time it takes me to go from Porto to Santiago. I promise to spend at least 5 minutes looking at one single posterior distribution, and to fit a model with 20 times more parameters than data points, which clearly sounds like fun. | |
| April 27, 2017 | Time Series Analysis - searching and evaluating periodic signals in your data | Liz Bartlett | In this MCMC I’m going to talk about a popular method for searching for periodic signals in time domain astrophysical data: The Lomb-Scargle periodogram. I will show examples from different wavelength regimes and areas of astrophysics and discuss the strengths and weaknesses of this tool, as well as some of the common pitfalls of its use. | |
| November 16, 2017 | How to statistically distinguish several distribution? | Marion Villenave | I will present very briefly a non-parametric method that tests differences between several independent groups. The Kruskal-Wallis statistical test is based on the rank on data from the different groups. I used it in the context of protoplanetary disk evolution to test whether differently aged star forming regions can be statistically distinguished. This test has the advantage to be able to compare multiple distributions all together. | 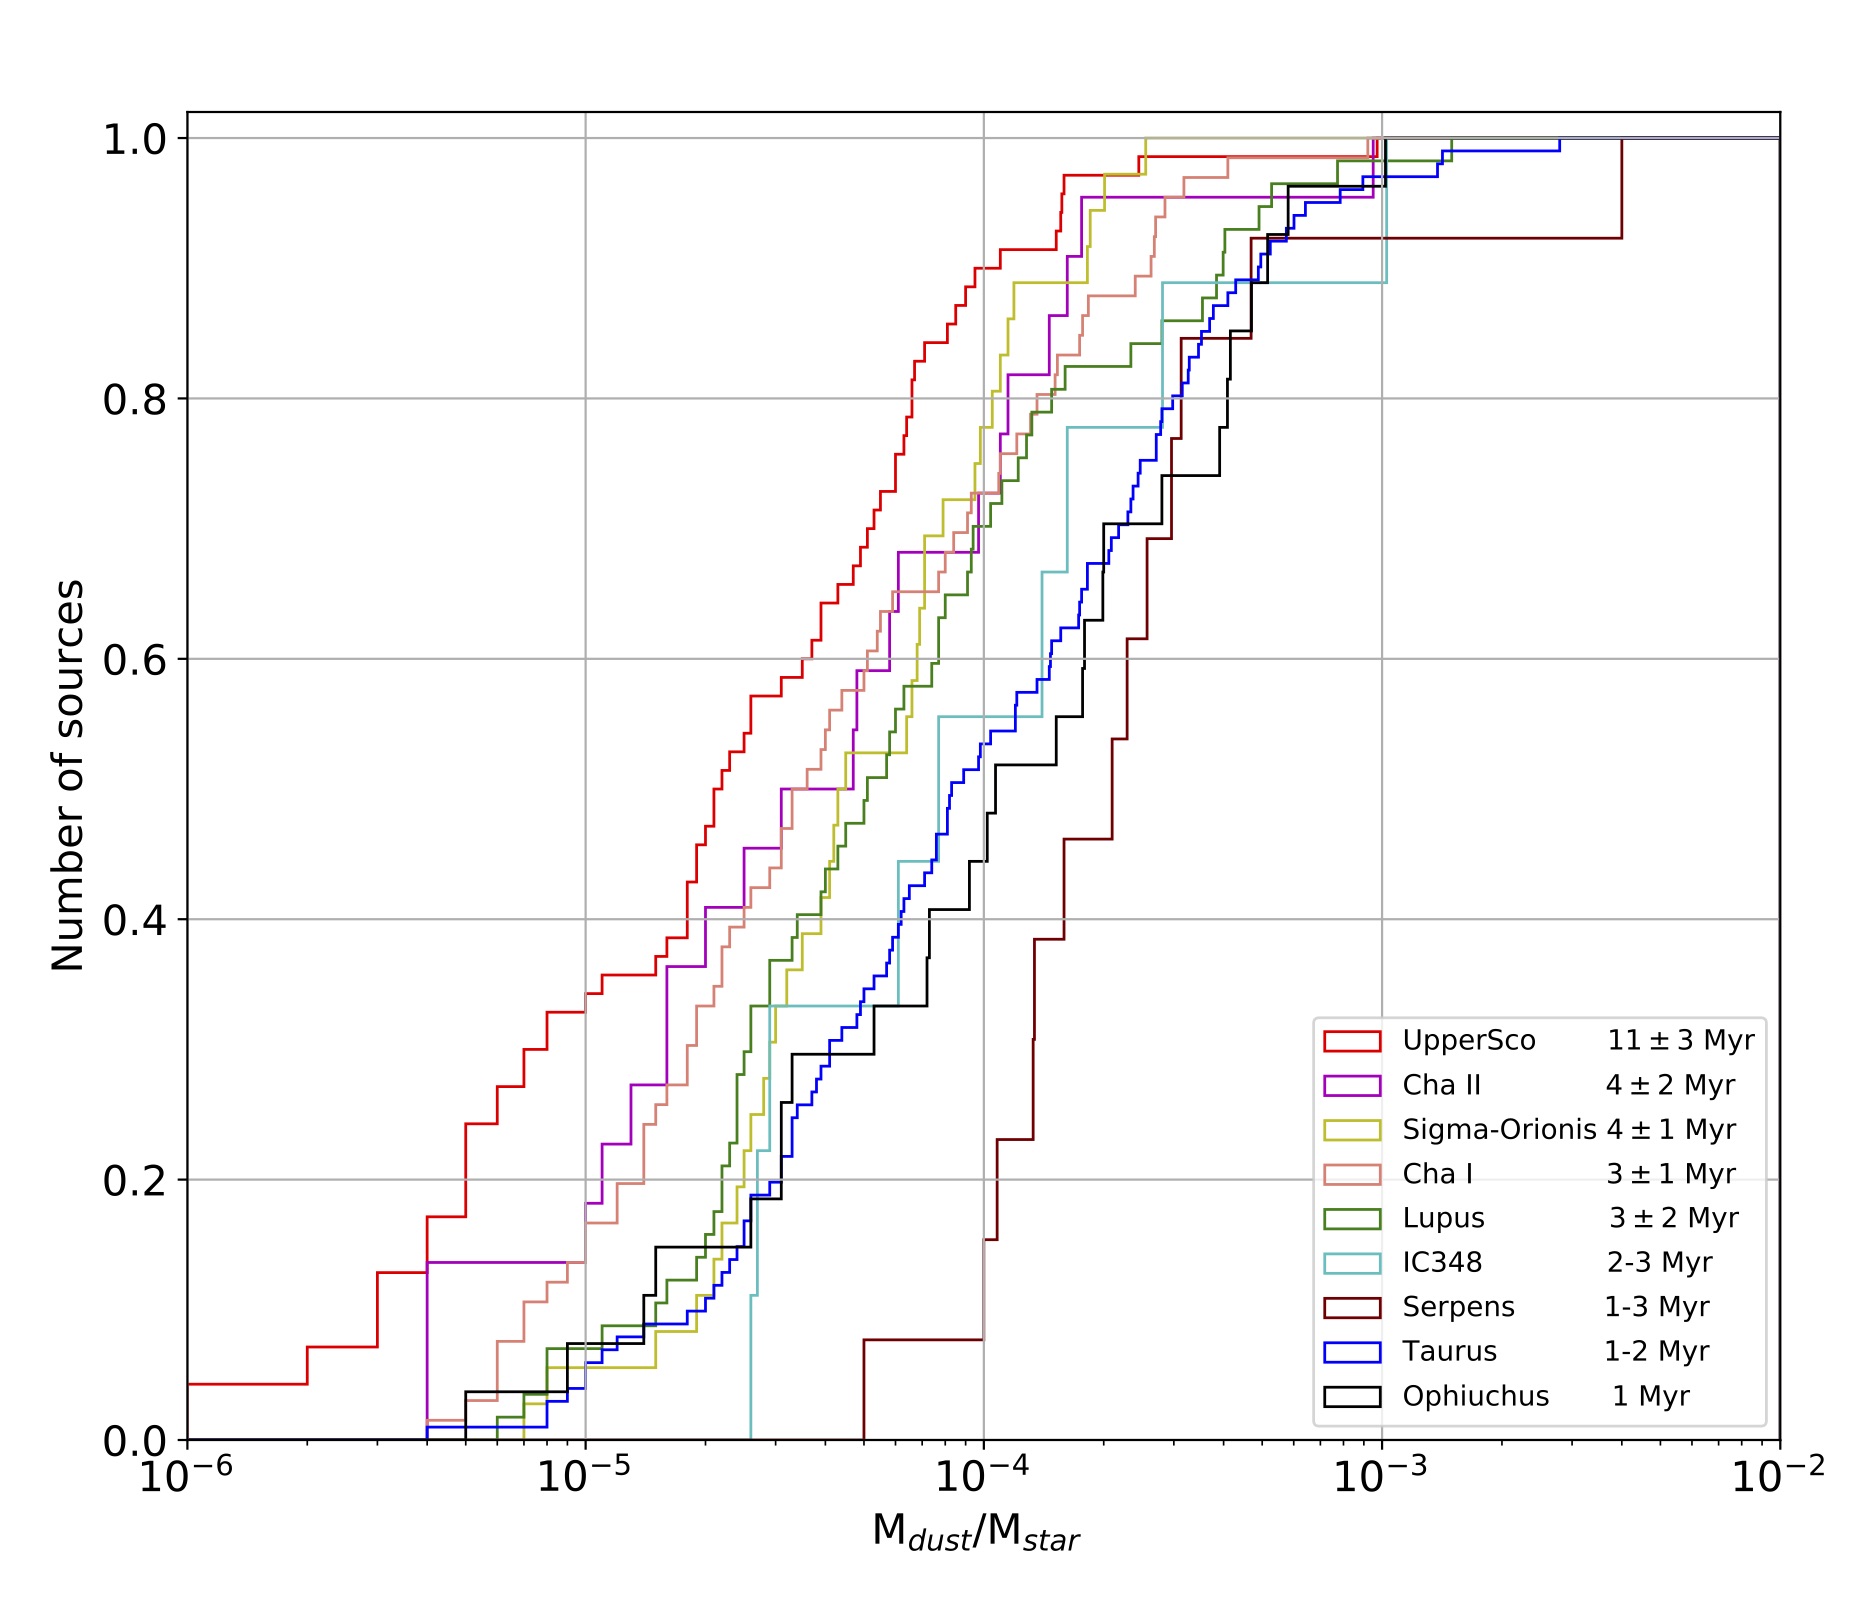 |